Simple Linear Regression
import pandas as pd
import seaborn as sb
from matplotlib import pyplot as plt
path = '../data/insurance.csv'
df = pd.read_csv(path)
Simple Linear Regression#
A regression model that estimates the relationship between one independent (predictor/ xs) variable and one dependant (response/ ys) variable
\(y = \alpha + \beta x \)
\(\beta\) = slope
\(\alpha\) = y-intercept
\(y\) = y- coordinate
\(x\) = x-coordinate
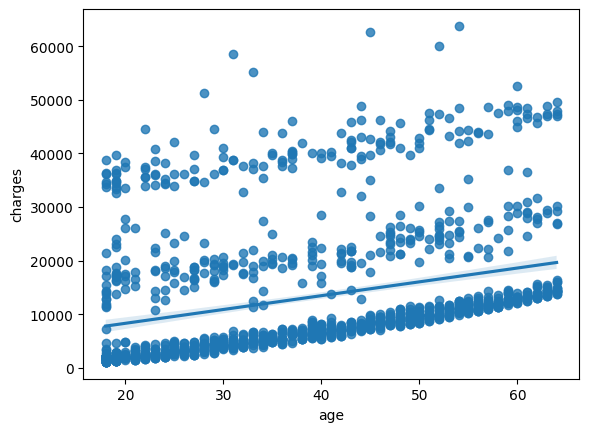
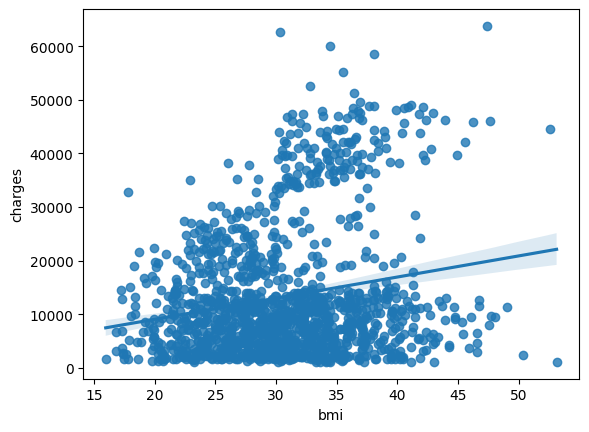
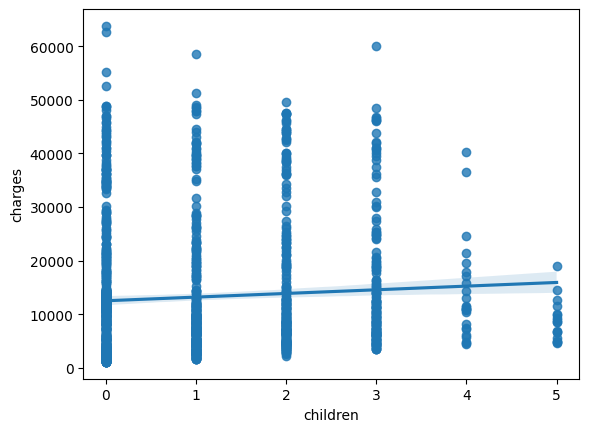
number_columns = df.select_dtypes(include='number').drop('charges', axis=1)
for column in number_columns:
    sb.regplot(x = column, y = "charges", data = df)
    plt.show()


